Showing posts with label lecture. Show all posts

Wednesday, May 13, 2009

Data Visualisations

The lecture this week was all about Data, and more specifically data visualisations. Data visualisations is basically an abstract way in representing data, key points in creating this abstract effect include; scale, colour, shape, position, movement. With the new age of the Internet, data visualisations have grown in the capabilities in how they can function. With such things as API’s, people can create data visualisations that collect data from numerous sites; they can then process this data, and create an interesting way to look at the information. A great example of this is the website known as ‘We Feel Fine.’


‘We Feel Fine’ collects people's thoughts from twits, blogs and the like. This information is then collaborated in a very interesting way. There are six different views, all very different to each other. Each individual thought however has a certain colour, depending on what emotion the thought is conveying. The first and most identifiable view is the ‘madness’ view, which to me looks like a bunch of small balls, atoms perhaps, moving around the page, all on an individual path.
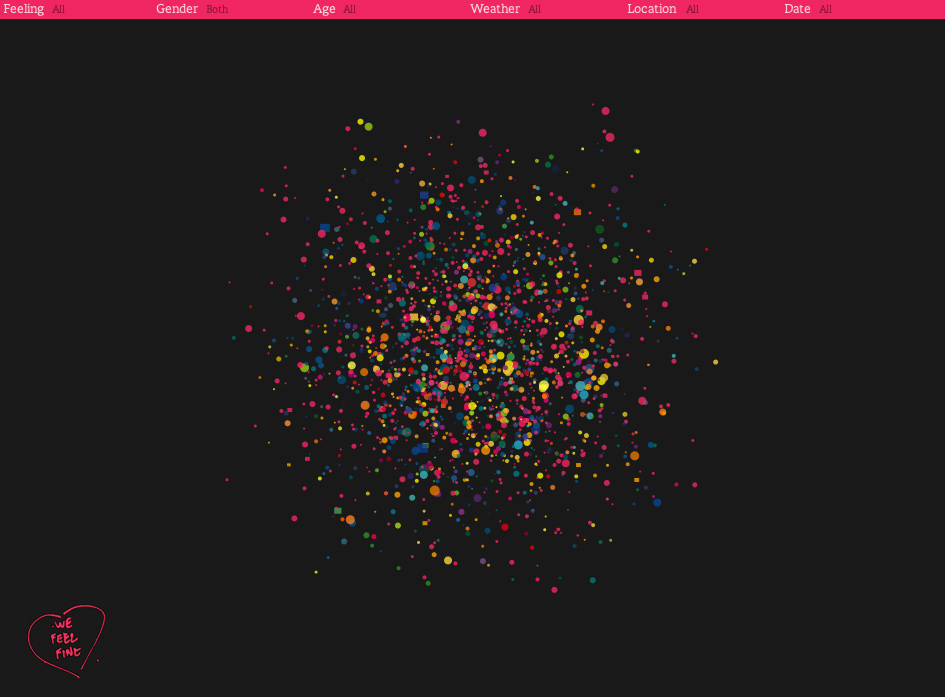

All you have to do in this view is click onto on of the moving balls, and the attached thought appears at the top of the page. The thought is linked to the original source, so if you wanted to see the person behind the thought, it is just one click away.


Round balls are just thoughts, while the less common square shapes are a photo with a relating thought.



The other views, all though very different, function in a similar way. The view is only a tool to present the important data, that of human emotions and thoughts. The data can be broken down, into ages, and sex, to see what emotion a certain age group or sex, is feeling around the world. This data visualisation is very cool, and I recommend you check it out.
An example of another data visualisation that I personally found really interesting is the site known as Word Count. It ranks 86, 800 words most commonly used in the English language. The words are set out on a timeline from most common to least commonly used. The more common the word is, the bigger it appears in size. There is also a search bar, enabling you to search certain words to check out what number they are ranked. Not surprising, the most commonly used word is ‘the.’ Interestingly enough the first verb to appear is ‘have,’ which was ranked number 21. It was fun to type in my name, and then my friends names to see where I ranked compared to them. Then the question rises whether one would want a common name, or an uncommon name. I wonder what would be the first name to appear on the timeline, Jesus perhaps?
Even just sitting here I am thinking of words that I would want to search…
Supercali Fredigliosudocis.
Disney.
Sex.
Tequila.
Tissue.
Mouse.
Chair.
Book.
Keyboard.
Lamp.
Yes I am now just naming things within eye distance…

Overall I think that data visualisations is an awesome way to present data, it allows the user to interact, to have fun, to explore, and to learn!

Sunday, May 10, 2009

Week Eleven

This week we had a really interesting lecture on multiplicity. The lecture was a basic introduction into this concept, that for personally was an eye opener to the things that we can be achieved with computers and the networked media. Multiplicity is the idea of “many-ness” with the collaboration of similar things that unite together. An environmental example is that of a flock of birds, where every single bird is their own individual being, but when they fly together, they unite and form intricate puzzle like shapes, allowing them to fly in harmony. A media example is of the 1K Project, where a man played a car racing game 1000 times on the same track, and collaborated all these games into the one video, with an amazing result. I don’t know whether to admire the video or the sheer fact that he had to play 1000 games.


Another amazing media example is the photo works of Peter Funch and his NYC street scenes. Peter Funch spent weeks taking photos on Manhattan street corners, to then edit similar themes together to create single photographs, with a result that is bound to amaze you.
I especially like this photo, a NYC street filled with children, something that could never possibly happen in reality. The photo really embodies innocence and youth, and makes me wish that I was still young, without a care in the world.


I also quite like this image, a close up of people with varying degrees of emotion. I think that I am drawn to this photo as it depicts raw emotion. All these people edited together in the one street scene creates an overwhelming amount of emotion.


I feel multiplicity is best understood with examples, and I think that these examples are relevant, and incredibly interesting through their explorations of unique concepts.

In the tutorial we discussed multiplicity some more, and Nathan showed us the above examples, which helped me get a better grasp on what multiplicity actually is. Nathan also went around discussing assignments with everyone, and after telling him of my desire to do assignment 2, the geo-narrative, he said that next week we would learn the technicalities of using google maps, which will help as this a component of what is required in the assignment. I finished off the lesson with reading ‘21 Steps,’ which is a story that uses google maps as a platform to narrate the story. This helped give me ideas for my own assignment, mainly not to have a shit and anticlimactic ending as ‘21 Steps’ did, so not to make the reader feel that they wasted their life away on reading a shit ending. However, the way that '21 Steps' was created was really interesting, and the story flowed well with the changing locations, but I feel that the ending was terrible, and after spending a fair amount of time reading it, it would have been at least an hour, I feel like it was a waste of time, as the ending was THAT shit.

Saturday, May 2, 2009

Week Ten

Week Ten was all about the Internet and now, what is known as Web 2.0
The name, Web 2.0, basically means the second generation of the web. Of course this can not actually happen, as the Internet changes on a minute basis. Daily, new sites are created and new ways of presenting a site are formed, along with more technical things, that it is impossible to say that the Internet has reached and stays at a certain level. True it has reached a new generation, with more than one billion people in the world connected online. The Internet is becoming more user friendly, and there are popular sites forming created and maintained by the public. A great example of this is none other than Wikipedia. Wikipedia is an online encyclopedia, that enables the world wide public to add, contribute and edit the content. This means that articles can have well rounded information, yet some articles are prone to the odd lie here and there. Something that really interests me is that facebook has been built by its 200 million users, and together the 200 million users have created an asset worth 3.7 billion dollars. Naturally this money goes to a tiny, tiny, tiny, tiny, tiny percentage of the 200 million users. So basically, facebook is only worth so much, due to the sheer amount of people on the site. This is quite overwhelming, that 200 million people can easily make something worth 3.7 billion dollars. It may even be something to appreciate being one of those 200 million users. Yet somehow I can’t help to feel saddened by my lack of current wealth. Basically the more people that use a service, the more useful it becomes. This is definitely true with Amazon, a website containing the worlds largest collaboration of books, films, and music. Through the sales of a certain product, Amazon has been able to create a database of recommendations that their users have. This comes in handy when a customer is looking at a certain novel and sees another novel recommended by fellow users, a novel that perhaps also interests them. This has in fact allowed books to come back into printing, which has actually led to books becoming bestsellers, even after years of already being published, this all is able to happen though the wonders of Web 2.0.
This is just a picture that I found on a blog and I think that it embodies what I feel Web 2.0 means.
(Source)
Web 2.0 is all about the people, the people created and now maintain Web 2.0. Without the people, the Internet would not have come as far as it has, and without the people, it will not reach its true potential. With more and more people connecting online, who knows what the future of the Internet holds?
Hello Web 3.0!

I nearly forgot! During the tutorial we watched a video that I think I may possibly have fallen in love with. Love at first site, what can I say?
Titled – ‘We Didn’t Start the Flame War’ by College Humour, I think that it is pretty self explanatory…

Friday, April 3, 2009

Carving Up This Blog Post

The lecture this week was ‘Carving Up the World.’ It was almost a philosophical way at looking at how the internet works. The lecture was looking at the different structures of thinking, which developed onto the way we form patterns. Juss like there are set structures of how to publish a book (the title on the front cover, with the authors name, the logo of the publisher on the spine, a blurb on the back, etc.) there are now structured ways on how to present a website. These structures form a convention, for example when creating a website, a home page with navigational elements is a smart idea to use. Sometimes these conventions are good to follow, for instance driving on the left hand side of the road in this country is a convention that should be wisely followed, but other conventions are sometimes worth breaking. When working with the html and CSS, it is good to try to develop different ways to form and present a site. These new ways, help to expand the capability of the internet.
‘Carving Up the World,’ was really just a way to discuss the conventions of society in reference with the internet. The lecture basically discussed carving up the internet and dividing it up into chunks; this could dividing it up with the use of tags, a form of indexing, to allow the creation of new websites with the wonders of API’s. With the forever expanding internet, new ways to form this medium will be discovered, and with that new ways to carve the internet with be developed naturally along the way.

Saturday, March 21, 2009

API – What I like to call: Appreciation, Practise, Interest

Sure I know that API actually means; Application Programming Interface but I wanted to be a bit witty, and show how I became to appreciate API’s, through practise resulting in an interest.
In the lecture we discussed API’s, going into slight depth in how they worked and the purpose of them. At first I didn’t really understand the point of it and how the hell it would be useful. It did finally hit me that it can be used for good, when Max was showing us all the different examples of how people use API's to create a site. It became clear, through these examples that API’s really do allow for the combination of different services, a mash-up of data so one can create a whole new site.
The most useful site would have been the combination of Google maps and the location of the Victorian bushfires. The site allowed a clear location where the fires were situated and whether they were still life threatening to residential areas, or whether they were under control. There were other examples, although created for a bit more fun, like combining Twitter updates with Google maps, to watch as people update their Twitters from all around the world, showing the person's location.
To further appreciate the use of API’s; practise is vital. In our tutorial we used a program called Yahoo Pipes. At first it seemed that we were just creating an RSS feed but soon we were shown how to add more options and create different things with the use of API’s, like a search engine, looking up a subject from both flickr and Twitter.
With the use of Yahoo Pipes it was easier to understand how API’s could work but more importantly how they could benefit us right now, because I sure am not creating a site using API’s anytime soon, but Yahoo Pipes is a great source to help us presently in our own personal exploration in API’s and the internet.
With this practise comes appreciation for API’s, then finally an interest in further developing my skills and use of such a cool invention.

Tuesday, March 10, 2009

wasted time, wasted time not...

The highlight of today’s lecture would have been the fact that I drove all the way out to Bruce for a lecture that only went for half an hour. Without feeling like I have wasted petrol and thus contributing to global warming, I get comfort in the fact that I learnt HTML and CSS. My last experience would have been a very, very, very basic introduction back in year nine IT class, being four years ago I remember absolutely nothing. I would be lying if I said I didn’t learn anything because I did, although if I were to ask to build a website using HTML and CSS, my head would likely explode. So I’m hoping that in tutes we will further develop or learning of these two things that seem pivotal in passing the course.